3-Minute Man
Gross: +$589.79
Net: +$487.64
Loss From Top: $64.10
Trades: 64
Shares Traded: 116442
Stocks Traded Today (net profit/loss):
Ford (F): +$182.27
AT&T (T): +$159.91
Time Warner (TWX): +$104.57
Walmart (WMT): +$86.93
EMC Corp (EMC): +$58.50
Advanced Micro Devices (AMD): +$56.48
Motorola (MOT): +$32.08
Disney (DIS): +$25.70
Micron Tech (MU): -$0.22
Home Depot (HD): -$51.34
Exxon Mobil (XOM): -$63.68
Corning (GLW): -$103.57
Nooo....it's not what you're thinking!
For the last few trading days, I've had a 3-minute chart up in addition to my usual 1-minute charts. Whenever I was in a position, I'd bring up the 3-minute chart and the 1-minute chart and my goal was to try to use the 3-minute charts to determine when I should get out of a position and for identifying trends.
Unfortunately I've been having chart trouble for the last little while (see the last few posts), but I started getting comfortable looking at the 3-minute chart.
And so, today I changed all my charts to 3-minute charts (with the exception of the Futures charts - I'll keep them at 1-minute and 5-minute).
I still have a long ways to go, but I'm really trying to watch the charts instead of the Level II when I'm in a position.
I know I'm a little late to the game and most others out there in the blog-o-sphere are using 5-, 15-, and 30-minute charts, but you have to understand that as a scalper that holds for only a few seconds to a few minutes and as a scalper that has a very tight stop-loss (usually 1, 2 or 3 cents), I'd get chopped to hell using longer-term charts.
But, I'm working on holding positions longer and if I want to use charts to dictate when I should exit my position, I'll have to change to a multi-minute chart.
Here's an example. Take a look at the following Walmart (WMT) charts for today. On the left is the 1-minute chart and on the right is the 5-minute chart (sorry, I couldn't find anything online that has 3-minute charts). In particular, look at the circled area of the chart (which highlights the same move on WMT).
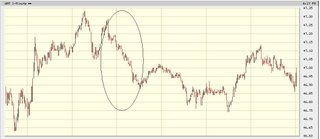

I don't know about you, but if I were in a short position and I were looking at the 1-minute chart, I'd be paring my position several times on every little uptick.
However, had I been looking at the 5-minute chart (in my case, 3-minute....don't worry, I'll eventually work my way up to a 5-minute), it's definitely easier on the eyes and the trend is clearer.
So my transition to 3-minute charts is just the first step to clearing all that noise that the 1-minute chart displays. Now I've got to work on relying on the charts and not what the Level II is telling me (plus I've got to start getting comfortable holding positions for up to an hour!!!).
I won't bore you with today's system problems this morning (just see the posts from the previous two days - today was no different, if not a little worse). After about 11AM, the system stabilized and the charts were actually acting much better today (I only had to restart it 4 times today!).
At around 2PM we started having problems with orders and we were told not to put out any additional orders. I don't know if we came back up or not, but I took this as a sign to go home...I had some errands to run anyways so I thought I get them done before the rush hour crowds made their way home.
I was quite surprised at the number of stocks I traded today. This could be because I switched over to 3-minute charts, which had me changing the charts to different stocks a lot (with 3-minute charts I can more easily assess whether trends existed or not).
Two good trades versus no bad trades today.
Good Trades
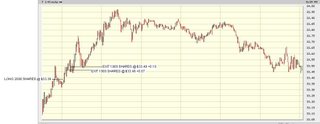
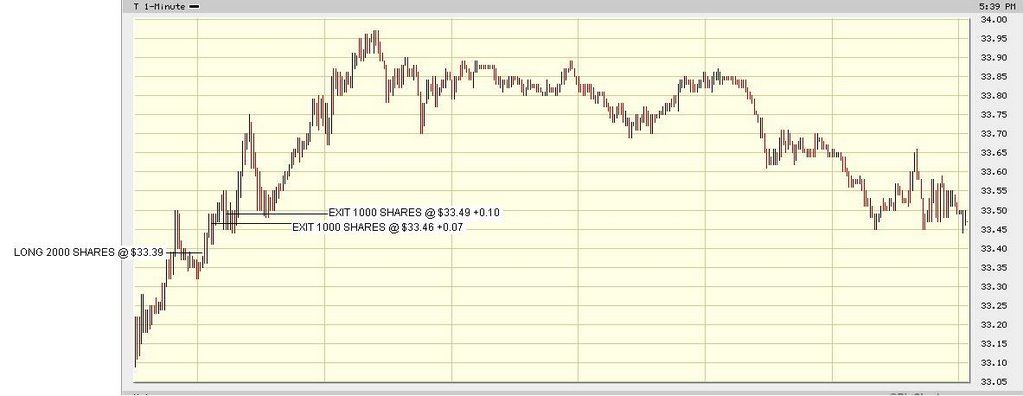
10:04:20AM - AT&T (T) was moving up and so were the Futures. The Futures popped up so I went long 2000 shares. When the move stalled a but, I took half my position out. AT&T moved up a little further and the Futures started moving back down and I got the other half out. I got out as follows: 7-cent winner (1000 shares), 10-cent winner (1000 shares) ($170 profit before fees ; Long 2000 shares @ $33.39 ; Out: 10:06:24AM)
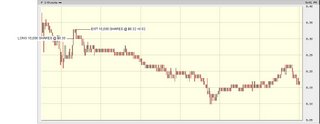
10:18:59AM - Ford (F) looked like it caught some support and started moving up while the Futures were moving sideways. Ford came up to the $8.30 level which had some relatively big size on the offer. When it broke, I went long 10,000 shares. Ford moved up a bit, but it seemed like sellers were not letting it go further and so I got everything out for a 2-cent winner ($200 profit before fees ; Long 10,000 shares @ $8.30 ; Out: 10:19:39AM)
Bad Trades
None.
Net: +$487.64
Loss From Top: $64.10
Trades: 64
Shares Traded: 116442
Stocks Traded Today (net profit/loss):
Ford (F): +$182.27
AT&T (T): +$159.91
Time Warner (TWX): +$104.57
Walmart (WMT): +$86.93
EMC Corp (EMC): +$58.50
Advanced Micro Devices (AMD): +$56.48
Motorola (MOT): +$32.08
Disney (DIS): +$25.70
Micron Tech (MU): -$0.22
Home Depot (HD): -$51.34
Exxon Mobil (XOM): -$63.68
Corning (GLW): -$103.57
Nooo....it's not what you're thinking!
For the last few trading days, I've had a 3-minute chart up in addition to my usual 1-minute charts. Whenever I was in a position, I'd bring up the 3-minute chart and the 1-minute chart and my goal was to try to use the 3-minute charts to determine when I should get out of a position and for identifying trends.
Unfortunately I've been having chart trouble for the last little while (see the last few posts), but I started getting comfortable looking at the 3-minute chart.
And so, today I changed all my charts to 3-minute charts (with the exception of the Futures charts - I'll keep them at 1-minute and 5-minute).
I still have a long ways to go, but I'm really trying to watch the charts instead of the Level II when I'm in a position.
I know I'm a little late to the game and most others out there in the blog-o-sphere are using 5-, 15-, and 30-minute charts, but you have to understand that as a scalper that holds for only a few seconds to a few minutes and as a scalper that has a very tight stop-loss (usually 1, 2 or 3 cents), I'd get chopped to hell using longer-term charts.
But, I'm working on holding positions longer and if I want to use charts to dictate when I should exit my position, I'll have to change to a multi-minute chart.
Here's an example. Take a look at the following Walmart (WMT) charts for today. On the left is the 1-minute chart and on the right is the 5-minute chart (sorry, I couldn't find anything online that has 3-minute charts). In particular, look at the circled area of the chart (which highlights the same move on WMT).
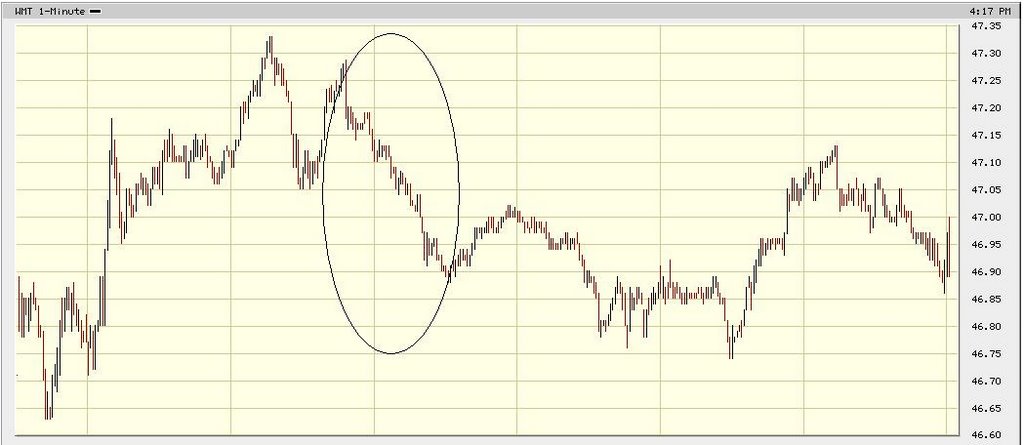

I don't know about you, but if I were in a short position and I were looking at the 1-minute chart, I'd be paring my position several times on every little uptick.
However, had I been looking at the 5-minute chart (in my case, 3-minute....don't worry, I'll eventually work my way up to a 5-minute), it's definitely easier on the eyes and the trend is clearer.
So my transition to 3-minute charts is just the first step to clearing all that noise that the 1-minute chart displays. Now I've got to work on relying on the charts and not what the Level II is telling me (plus I've got to start getting comfortable holding positions for up to an hour!!!).
I won't bore you with today's system problems this morning (just see the posts from the previous two days - today was no different, if not a little worse). After about 11AM, the system stabilized and the charts were actually acting much better today (I only had to restart it 4 times today!).
At around 2PM we started having problems with orders and we were told not to put out any additional orders. I don't know if we came back up or not, but I took this as a sign to go home...I had some errands to run anyways so I thought I get them done before the rush hour crowds made their way home.
I was quite surprised at the number of stocks I traded today. This could be because I switched over to 3-minute charts, which had me changing the charts to different stocks a lot (with 3-minute charts I can more easily assess whether trends existed or not).
Two good trades versus no bad trades today.
Good Trades
10:04:20AM - AT&T (T) was moving up and so were the Futures. The Futures popped up so I went long 2000 shares. When the move stalled a but, I took half my position out. AT&T moved up a little further and the Futures started moving back down and I got the other half out. I got out as follows: 7-cent winner (1000 shares), 10-cent winner (1000 shares) ($170 profit before fees ; Long 2000 shares @ $33.39 ; Out: 10:06:24AM)
10:18:59AM - Ford (F) looked like it caught some support and started moving up while the Futures were moving sideways. Ford came up to the $8.30 level which had some relatively big size on the offer. When it broke, I went long 10,000 shares. Ford moved up a bit, but it seemed like sellers were not letting it go further and so I got everything out for a 2-cent winner ($200 profit before fees ; Long 10,000 shares @ $8.30 ; Out: 10:19:39AM)

Bad Trades
None.
posted by J.C. at
6:36 p.m.
![]()


6 Comments:
Hey JC, congrats on todays fine work. I am wondering what type of futures chart are you using...and if there are any good programs out there on the net.
Lata
By Anonymous, at November 29, 2006 8:01 p.m.
Hi, J.C.
My name is Ikuo Mori who lives in Japan.
I enjoy reading this website.
Anyway I'm thinking about purchasing the information product about stock trading, but I have no idea of which American
Trading consultants who has good reputation by selling the product are good.
If you know, could you tell me the name of some Trading consultant?
If you tell me about 10 consultant, I'll offer $50-100 for the information.
My e-mail address is
bluehawaii1979527@yahoo.co.jp
Thanks for your cooperation
Ikuo Mori
By Anonymous, at November 29, 2006 8:56 p.m.
Lata,
Thanks for your comments. I keep an eye on the e-mini S&P Futures charts and the charting software is an in-house developed application...this is free for us to use, though with the problems we've been having, I should consider paying for charts. The most popular programs for charting at the office is eSignal. Another choice can be found at Prophet.net.
Ikuo,
Thanks for your comment. Perhaps some of the readers out there would like to help out Ikuo. What you can do is maybe visit some of the other blogs I have listed on the sidebar - there are lots of recommendations made by the more popular bloggers. I'm sorry I couldn't be of more help, but I'll email you if I hear anything!
Happy trading!
By J.C., at November 29, 2006 9:20 p.m.
Hi JC
Great to see you making that step away from level 2 and by watching the charts. Trust the charts not L2 and the big bucks will roll in. You had a good day!
In a year from now you would of moved up to 15 and 30 min charts, and scoring $ runs! LOL. That's the aim anyhow.
Good luck.
Lee
By Anonymous, at November 30, 2006 3:38 a.m.
Hi Lee, you might not know that a prop trader can't afford 3 to 5 cents loss and therefore charts won't help you from being stopped out by the system. Charts will help but top prop trader only pay little attention to charts.
By Anonymous, at November 30, 2006 5:42 a.m.
Lee,
Thanks for your comments. With the way I trade, I'll have to use some kind of hybrid L2 and charts. I'll try my best!
Anon@5:42AM,
Thanks for your comments. That's exactly the reason I have a tough time just looking at charts. I believe that there is a time to look at the charts and a time to look at the L2. I believe that once the position has moved in your favor for a few cents, that's the time to start looking at the charts. BUT, when you get into a position initially, you may have to pay attention to the L2 just in case it goes against you.
Anyhow, I wish all traders out there a kick ass December (I know I need it)!
By J.C., at November 30, 2006 5:19 p.m.
Post a Comment
<< Home